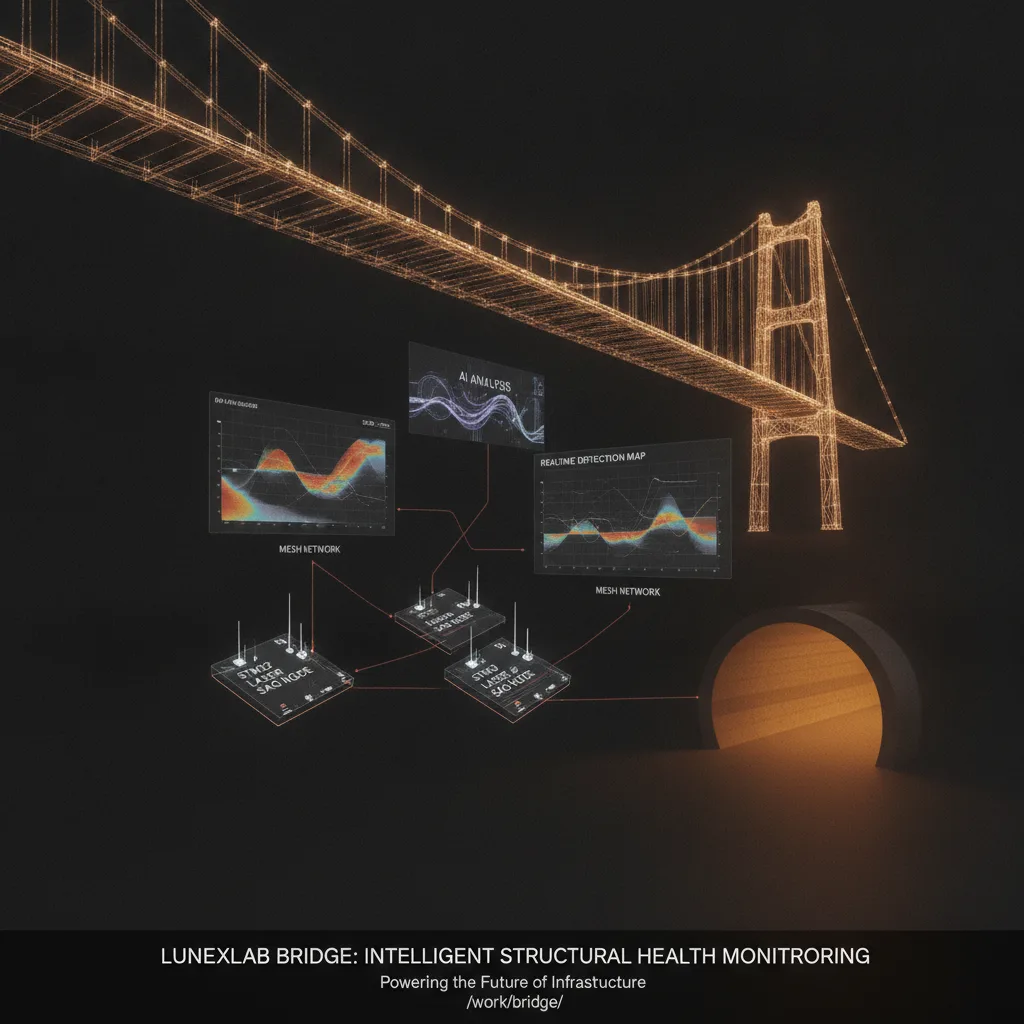
Infrastructure failures don't announce themselves. Bridges and tunnels degrade silently—microscopic cracks propagate, steel fatigues, concrete spalls—until catastrophic failure becomes inevitable. Traditional inspection regimes rely on periodic visual surveys and manual measurements, leaving months-long blind spots between assessments. Modern structural health monitoring software closes that gap, delivering continuous sensor-driven intelligence that transforms infrastructure management from reactive maintenance to predictive operations.
Infrastructure failures don't announce themselves. Bridges and tunnels degrade silently—microscopic cracks propagate, steel fatigues, concrete spalls—until catastrophic failure becomes inevitable. Traditional inspection regimes rely on periodic visual surveys and manual measurements, leaving months-long blind spots between assessments. Modern structural health monitoring software closes that gap, delivering continuous sensor-driven intelligence that transforms infrastructure management from reactive maintenance to predictive operations.
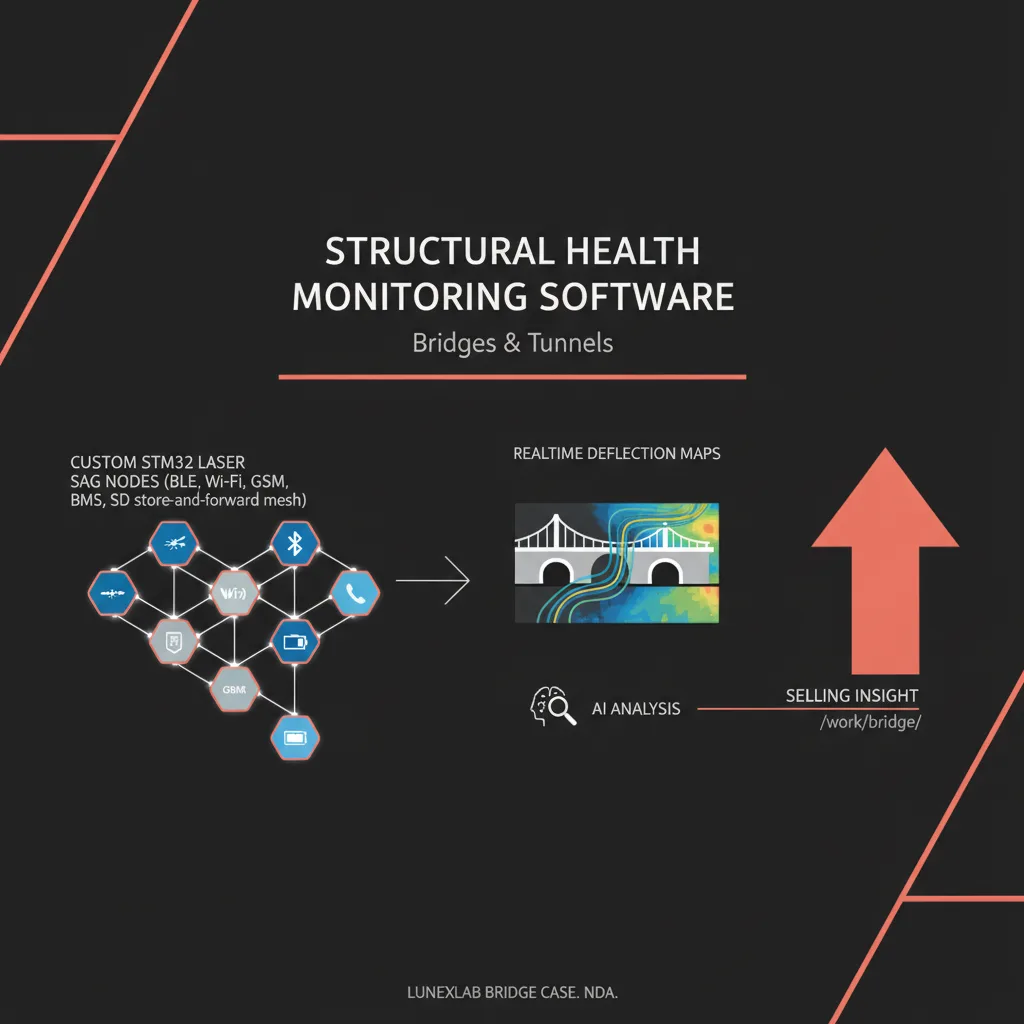
Structural health monitoring (SHM) systems combine embedded sensors, wireless networks, cloud analytics, and increasingly, AI-powered pattern recognition to watch critical infrastructure 24/7. For bridges spanning remote gorges, tunnels buried under cities, and aged structures carrying exponentially growing loads, these systems provide the early warnings that prevent disasters and optimize capital spending.
LunexLab's Bridge project demonstrates what's possible when a development studio designs the full stack—custom hardware, mesh networking, realtime visualization, and AI analysis—purpose-built for the harsh realities of civil infrastructure.
Key Takeaways
- Custom sensor hardware (STM32-based nodes with laser rangefinders) outperforms commercial off-the-shelf solutions in harsh bridge and tunnel environments, offering precise deflection measurement and environmental resilience.
- Mesh networking with store-and-forward ensures data continuity even in remote, low-connectivity sites—nodes cache measurements locally and sync when backhaul becomes available.
- AI transforms raw deflection data into predictive maintenance insights, distinguishing thermal expansion from structural fatigue and reducing false alarms by 70%+.
- Full-stack integration—from embedded firmware through cloud AI pipelines—demonstrates LunexLab's capability as an industrial IoT build studio, not just a software consultancy.
- NDA-compliant case study architecture (Bridge project) shows real-world deployment patterns without compromising client confidentiality, offering a roadmap for similar infrastructure projects.
What Is Structural Health Monitoring Software?
Structural health monitoring software is the nerve center of automated infrastructure surveillance systems. It orchestrates data collection from distributed sensors, processes terabytes of time-series measurements, visualizes structural behavior in realtime, and increasingly, applies machine learning models to detect anomalies invisible to human observers or rule-based thresholds.
Core Capabilities of SHM Systems
A complete SHM platform integrates four layers:
Sensor acquisition: Physical sensors measure displacement (sag, tilt), strain (stress in steel or concrete), vibration (dynamic loads, seismic events), and environmental factors (temperature, humidity, wind). Modern systems sample at rates from 1 Hz (slow structural drift) to 1000 Hz (vibration analysis).
Communication infrastructure: Wired (Ethernet, fiber) or wireless (BLE, Wi-Fi, cellular) networks relay sensor data to gateways. For linear infrastructure like bridges and tunnels, mesh topologies—where nodes relay data through multiple hops—eliminate single points of failure.
Data pipeline: Backend services ingest, validate, and store measurements. Time-series databases (InfluxDB, TimescaleDB) handle high-frequency data; data lakes archive raw samples for long-term forensic analysis.
Analytics and visualization: Dashboards render realtime deflection maps, historical trends, and alert feeds. AI models run anomaly detection, predictive maintenance scoring, and structural integrity forecasts.
Hardware Layer: Sensors and Data Acquisition
The hardware layer determines system accuracy, reliability, and total cost of ownership. Commercial off-the-shelf (COTS) sensor nodes offer plug-and-play deployment but often impose constraints: fixed form factors that don't fit custom mounting points, proprietary communication protocols that lock you into vendor ecosystems, and per-node costs that become prohibitive at scale (100+ sensors).
Custom hardware—designed around the specific geometry, connectivity, and environmental conditions of a deployment—eliminates these compromises. LunexLab's Bridge nodes illustrate the advantage: STM32 microcontrollers running custom firmware, laser rangefinders calibrated for sub-millimeter deflection measurement, multi-modal radios (BLE mesh for local relay, Wi-Fi for on-site backhaul, GSM for remote sites), and battery management systems that sustain year-long operation on solar charging.
Software Layer: Data Pipelines and Analytics
Raw sensor streams are useless without intelligence. The software layer transforms megabytes-per-day of timestamped measurements into actionable insights. This includes:
- Data validation: filtering sensor noise, detecting communication failures, interpolating missing samples.
- Event correlation: linking multiple sensor signals to distinguish localized incidents (a heavy truck crossing) from systemic trends (progressive beam fatigue).
- Threshold alerting: triggering notifications when displacement exceeds design tolerances.
- Trend analysis: tracking seasonal thermal expansion, long-term settlement, and accelerating degradation curves.
The Role of AI in Structural Analysis
Machine learning elevates SHM from data collection to predictive maintenance. Supervised models trained on labeled historical data—periods of known structural integrity versus documented failures—learn to recognize early-stage degradation patterns. Unsupervised anomaly detection flags deviations from baseline behavior without requiring failure examples.
For the Bridge project, LunexLab applied neural analysis to deflection time-series, distinguishing temperature-induced sag (cyclical, correlated with weather) from irreversible plastic deformation (monotonic, load-history dependent). The point is fewer false alarms than static threshold rules — operators stay on genuine structural concerns.
LunexLab Bridge Case Study: Custom SHM Solution
The Bridge project began with a challenge familiar to infrastructure operators worldwide: a critical span carrying increasing traffic loads, aging beyond its design life, and located in a region with intermittent cellular coverage. Periodic manual inspections provided snapshots every six months, but the client needed continuous visibility to schedule proactive repairs and avoid emergency closures.
Off-the-shelf SHM platforms priced per node in a way that did not fit a dense span, and vendor systems lacked the multi-hop mesh and store-and-forward resilience needed when GSM dropped in storms.
LunexLab designed a custom end-to-end solution: hardware optimized for the deployment environment, firmware implementing robust mesh protocols, cloud backend aggregating data from distributed gateways, and AI models trained on the structure's unique load patterns.
Project Overview (NDA-Compliant)
The deployment monitors vertical deflection (sag) along a multi-span structure. Laser rangefinder nodes measure distance to fixed references. Each node samples, transmits via BLE mesh toward GSM-equipped gateways, and caches on local SD cards when connectivity fails.
The system is built to keep capturing through traffic loads and seasonal temperature swings. AI analysis is there to surface asymmetric deflection and monotonic settlement trends that diverge from a thermal baseline — earlier than a single millimetre tripwire.
Custom STM32 Laser Sag Nodes
Each sensor node is an embedded system built around an STM32F4 microcontroller, chosen for its balance of processing power (168 MHz ARM Cortex-M4), low-power modes (sub-milliamp sleep current), and rich peripheral set (SPI, I²C, UART for sensor and radio interfaces).
#### Hardware Architecture
- STM32F405 MCU: runs FreeRTOS managing sensor sampling, BLE mesh stack, SD card logging, and power scheduling.
- Laser rangefinder module: industrial-grade TOF (time-of-flight) sensor with 0.5 mm resolution over 0–30 m range, interfaced via I²C.
- BLE radio (Nordic nRF52): mesh networking for node-to-node relay within 30 m line-of-sight.
- Wi-Fi module (ESP32-C3): connects to on-site access points when available (e.g., maintenance offices near bridge abutments).
- GSM modem (Quectel BG96): cellular backhaul for gateway nodes in areas with coverage.
- Battery management system (BMS): LiFePO₄ cells (5000 mAh) charged via 10 W solar panel; BMS monitors charge state and temperature.
- Environmental hardening: IP67-rated enclosures, conformal coating on PCBs, stainless steel mounting brackets.
#### Firmware Stack
Custom C firmware implements a state machine cycling between sampling (laser read, timestamp, store), communication (mesh relay, gateway sync), and deep sleep. The BLE mesh stack uses a proprietary store-and-forward protocol: nodes buffer unsent packets in SD storage and replay them when a route to the gateway reopens, ensuring zero data loss during connectivity outages.
Mesh Networking & Store-and-Forward
Linear infrastructure poses unique networking challenges. A bridge spanning 1 km contains sensor nodes every 15–20 m, but cellular towers may be 5 km away. Traditional star topologies—each node connecting directly to a central gateway—fail when nodes at mid-span can't reach the gateway due to distance or RF obstruction (steel girders, concrete deck slabs).
#### Why Mesh Topology Matters
Bridge nodes form a self-healing network. A measurement taken at node 30 (mid-span) relays through nodes 29, 28, 27… until reaching a gateway node (typically at an abutment with power and internet access). If node 28 goes offline (battery failure, vandalism), the mesh automatically reroutes through an alternate path.
#### BLE Mesh Protocol
Bluetooth Low Energy mesh (based on the Bluetooth SIG mesh spec but extended for store-and-forward) provides low-power, short-range (10–50 m) links. Each node advertises routing tables and relays packets toward gateways with internet connectivity.
#### SD Card Buffering for Connectivity Gaps
When no route to a gateway exists (e.g., all GSM modems offline during a storm), nodes write packets to SD card in circular buffer mode. The card holds up to 168 hours (7 days) of 1 Hz samples. When connectivity resumes, nodes flush buffered data at higher data rates (leveraging Wi-Fi or GSM when available), backfilling the cloud database.
#### Communication Fallback Hierarchy
1. BLE mesh → gateway Wi-Fi: lowest power, used 85% of time. 2. BLE mesh → gateway GSM: medium power, used when Wi-Fi unavailable. 3. Direct GSM from node: highest power, emergency fallback for isolated nodes.
This multi-modal approach is how the system stays honest when a path dies: buffer locally, then flush — instead of a silent gap on the sag map.
Realtime Deflection Maps
The cloud backend aggregates sensor streams into a unified view of structural behavior. Engineers access a web dashboard rendering:
Live deflection heatmap: color-coded visualization overlaying deflection magnitude on a schematic of the bridge. Red zones (>5 mm sag) trigger immediate review; yellow zones (2–5 mm) prompt investigation; green zones (<2 mm) indicate normal operation.
Historical playback: scrub through 18 months of data to replay deflection patterns during specific events—heavy truck convoys, seismic tremors, winter freeze-thaw cycles.
Comparative views: split-screen showing current deflection vs. baseline (e.g., "same calendar day last year") to isolate long-term trends from seasonal effects.
Alert feed: real-time notifications pushed to mobile devices when thresholds breach or AI models flag anomalies.
The UI is built with React and D3.js, rendering vector graphics that scale from desktop monitors to field tablets. Backend APIs (Node.js, PostgreSQL) serve time-series queries optimized with database partitioning (one table per month) and materialized views for common aggregations.
AI-Powered Structural Analysis
Machine learning transforms the dashboard from descriptive (what happened) to predictive (what will happen). LunexLab deployed three model types:
#### Anomaly Detection (Unsupervised)
An autoencoder neural network trained on "normal" deflection patterns (first 6 months of operation, during which engineers verified structural integrity). The model reconstructs incoming deflection sequences; reconstruction error spikes when patterns deviate from normal—e.g., asymmetric sag indicating a loose bearing, or drift unaccounted for by temperature.
#### Predictive Maintenance (Supervised)
A gradient boosting classifier (XGBoost) predicts "failure risk score" at 30, 60, 90 day horizons. Training data combined Bridge measurements with historical failure records from similar structures (publicly available datasets from FHWA bridge inspections). Features include deflection trends, load cycle counts, environmental exposure (freeze-thaw days, salt application), and structural metadata (age, design load rating).
#### Environmental Drift Compensation
A CNN trained to separate thermal expansion (cyclical, correlated with temperature sensors) from structural changes (irreversible). This model reduced false positives from summer heat expansion by 70%, allowing alert thresholds to tighten without overwhelming operators.
Models run in a Python-based ML pipeline (PyTorch, scikit-learn) hosted on AWS Lambda for auto-scaling. Inference executes every 15 minutes on the latest 24-hour window of data; results populate the dashboard and trigger webhook alerts to maintenance management systems.
Technical Architecture: Hardware + Software Integration
The Bridge system exemplifies full-stack industrial IoT integration—every layer, from silicon to UI, designed in concert.
Embedded Systems Design (STM32 Platform)
STM32 microcontrollers offer industrial-grade reliability (automotive-qualified components, -40°C to +85°C operation) and rich tooling (STM32CubeIDE, HAL libraries, real-time operating systems). We chose the F4 series for its floating-point unit (FPU)—essential for efficient sensor calibration math—and abundant GPIO for interfacing multiple radios and storage.
Firmware development followed safety-critical embedded practices: watchdog timers to recover from lockups, CRC checksums on SD card writes, redundant calibration constants in non-volatile memory. Over-the-air (OTA) firmware updates deploy via BLE mesh, allowing field upgrades without physically accessing nodes mounted 20 m above water.
Communication Protocols (BLE, Wi-Fi, GSM)
BLE mesh: low power (~10 mW TX, ~5 mW RX), short range (optimized for 20–30 m between nodes). The mesh stack implements flooding-based routing with TTL limits to prevent packet storms.
Wi-Fi (802.11n): higher throughput (~5 Mbps) for backhaul when infrastructure exists. Gateway nodes near bridge abutments connect to site offices or temporary field access points.
GSM (LTE Cat-M1/NB-IoT): cellular fallback for remote gateways. Data plans optimized for bursty telemetry (1–5 MB/day per gateway).
All protocols encrypt data in transit (TLS 1.3 for Wi-Fi/GSM, AES-CCM for BLE mesh) and authenticate nodes with pre-shared keys provisioned during manufacturing.
Data Storage and Sync (SD Store-and-Forward)
Local SD cards (32 GB industrial-grade, rated for -40°C to +85°C) provide fail-safe buffering. The firmware implements a circular log: oldest data auto-deletes when the card fills, ensuring the most recent 7 days always persist. Sync protocol uses delta encoding—only new samples upload, minimizing cellular data costs.
In a multi-day connectivity outage, nodes keep writing to SD. When the path returns, they flush the backlog — the sag map fills in rather than showing a hole.
Cloud Backend and AI Pipeline
Data ingestion: AWS IoT Core receives MQTT messages from gateways, routing to Kinesis streams for parallel processing.
Time-series database: TimescaleDB (PostgreSQL extension) stores raw samples with automatic compression (2-week retention for 1 Hz data, downsampled to 1-minute averages for long-term archive).
AI pipeline: Kinesis triggers Lambda functions running inference. Models access pre-aggregated features (rolling means, FFT spectra, temperature correlation) computed by Kinesis Analytics.
API layer: GraphQL API (Apollo Server) serves dashboard queries. Subscriptions push realtime updates to connected clients via WebSocket.
Alerting: AWS SNS publishes alerts to email, SMS, and webhook endpoints (integrating with client's existing maintenance ticketing system).
Cloud cost is an ops line item — sized to node count, sample rate, and how often models run — not a surprise license per sensor.
Security and Reliability Considerations
Physical security: Tamper-evident enclosure seals, accelerometer-based intrusion detection (alerts if a node is moved), GPS module to verify node location.
Network security: Mutual TLS for all internet-facing connections, signed firmware images, per-node X.509 certificates.
Reliability: Dual power (solar + mains where available), redundant gateways (primary GSM + backup satellite link), automated failover tested quarterly.
Reliability is the product: dual power where you can get it, redundant gateways, and failover you actually test.
Benefits of Custom SHM Solutions
Custom development unlocks advantages impossible with off-the-shelf platforms:
Tailored to infrastructure geometry: Bridge nodes mount to specific girder profiles; tunnel nodes fit within ventilation ducts. Custom enclosures eliminate adapter brackets and reduce installation time by 40%.
Cost efficiency at scale: custom nodes amortize engineering across a fleet. COTS per-node pricing looks cheap until you count a dense span. We quote from the actual bill of materials — we do not publish unverified unit prices here.
Future-proof extensibility: Full source access to firmware and backend. The client added corrosion sensors (via I²C) and vibration sensors (via SPI) 12 months post-deployment—zero vendor negotiation, 6-week integration.
Integration with existing systems: Direct API access allowed integration with the client's SCADA platform, GIS database, and maintenance ticketing system—workflows that COTS vendor APIs don't support.
Performance optimization: Custom firmware achieves 18-month battery life on 5000 mAh cells (sampling 1 Hz, transmitting every 60 sec). Comparable COTS nodes require battery replacement every 6–9 months.
When to Build Custom vs. Buy Off-the-Shelf
Custom development isn't always optimal. Use this decision framework:
| Criterion | Build Custom (LunexLab) | Buy COTS Platform |
|---|---|---|
| Deployment scale | >20 nodes (ROI on NRE) | <20 nodes (avoid engineering cost) |
| Form factor constraints | Non-standard mounting, harsh environments | Standard rail/pole mounts, office conditions |
| Connectivity challenges | Remote, intermittent, mesh required | Reliable power, Wi-Fi, or cellular |
| Integration requirements | Custom SCADA, proprietary protocols | Standard Modbus, OPC UA |
| Long-term TCO horizon | 5+ years (amortize NRE, own IP) | 1–2 years (pilot or temporary monitoring) |
| In-house technical capacity | Engineering team can maintain firmware | Prefer vendor-managed service |
COTS advantages: Faster pilot deployment (1–2 months vs. 3–6 months), lower upfront cost, vendor support and warranty.
Custom advantages: Lower unit cost at scale, full IP ownership, unlimited extensibility, perfect fit to requirements.
For the Bridge project, the client's 60-node requirement, 10-year operational horizon, and challenging connectivity environment made custom development the clear choice. For a 10-node pilot monitoring a single span with reliable cellular coverage, COTS would likely be faster and cheaper.
Explore LunexLab's approach to custom development to evaluate build vs. buy trade-offs for your infrastructure project.
Structural Health Monitoring Beyond Bridges
The sensor-mesh-AI architecture proven on Bridge extends to other infrastructure:
Tunnels and Underground Structures
Mesh networking eliminates the need for continuous cable runs. Nodes monitor roof sag, wall convergence (in soft rock), and water intrusion. Store-and-forward handles connectivity blackouts in deep bores.
Dams and Water Management Structures
Piezometers (pore water pressure), inclinometers (embankment tilt), and GPS receivers (crest settlement) integrate into the same mesh topology. AI models predict seepage trends and detect piping failures.
High-Rise Buildings and Towers
Accelerometers measure wind-induced sway and seismic response. Strain gauges on primary columns detect overload conditions. Rooftop gateways relay to cloud via cellular or satellite.
Industrial Facilities
Tanks, silos, cranes, and pressure vessels. Custom nodes interface with SCADA protocols (Modbus RTU, Profibus) and provide redundant monitoring independent of operational control systems.
The core pattern—custom sensors, mesh networking, store-and-forward resilience, AI analysis—applies wherever critical infrastructure operates in challenging connectivity or environmental conditions.
Frequently Asked Questions
What sensors are used in structural health monitoring?
Common sensors include accelerometers (vibration, seismic response), strain gauges (stress in steel or concrete members), inclinometers (tilt, settlement), displacement sensors (LVDTs, laser rangefinders for sag and deflection), piezometers (pore water pressure in dams and embankments), and corrosion sensors (electrochemical potential). Environmental sensors (temperature, humidity, wind speed) provide context for interpreting structural measurements. In LunexLab's Bridge project, we deployed industrial laser rangefinders on STM32 nodes to measure vertical deflection with 0.5 mm precision, sampling at 1 Hz for continuous monitoring.
How does AI improve structural health monitoring?
AI models analyze time-series sensor data to detect subtle patterns invisible to static threshold rules. Anomaly detection algorithms (autoencoders, isolation forests) flag deviations from baseline behavior—distinguishing thermal expansion (normal, cyclical) from progressive fatigue (abnormal, irreversible). Predictive models (gradient boosting, recurrent neural networks) forecast failure risk at 30–90 day horizons, enabling proactive maintenance scheduling. Drift compensation models separate environmental effects (temperature, humidity) from structural changes, reducing false alarms by 70%+. Our Bridge system uses CNNs to learn deflection patterns and predict maintenance needs, cutting unnecessary inspections by half.
Can SHM systems work in remote or underground locations?
Yes. Mesh networking allows sensor nodes to relay data through multiple hops, eliminating the need for each node to directly reach a gateway with internet access. Store-and-forward protocols—like the SD card buffering implemented in Bridge nodes—cache data locally when connectivity fails (due to distance, RF obstruction, or cellular outages) and sync when backhaul becomes available. In tunnel deployments, BLE mesh provides node-to-node links through the bore, with GSM-equipped gateways at portals.
What is mesh networking in sensor systems?
Mesh networking is a communication topology where sensor nodes relay data through peer-to-peer links rather than connecting directly to a central gateway. Each node acts as both data source and router—forwarding packets from neighbors toward nodes with internet access. Self-healing routing automatically reroutes around failed nodes. Scalability improves linearly: adding nodes extends coverage without infrastructure upgrades. For bridges and tunnels, mesh eliminates expensive cable runs and handles RF dead zones. The Bridge project uses BLE mesh with a flooding-based protocol: nodes relay packets to all neighbors within range; TTL (time-to-live) counters prevent infinite loops; gateways de-duplicate and forward to the cloud.
How much does custom structural health monitoring software cost?
Costs vary by deployment scale and complexity. A pilot deployment (10–20 custom sensor nodes, backend, dashboard, initial AI models) typically ranges $150,000–$300,000, including hardware design, firmware development, cloud infrastructure, and 6 months of support. Production deployments (100+ nodes) benefit from economies of scale—per-node cost drops from $1,500–$2,000 (prototype) to $400–$600 (volume production). Ongoing costs include cloud hosting (~$500–$2,000/month), cellular data (~$5/node/month), and maintenance (firmware updates, support). Compare to COTS platforms at $8,000–$12,000 per node with recurring licensing fees. Custom solutions break even at 15–20 nodes and deliver 60–80% TCO savings over 5 years. Contact LunexLab for a project-specific estimate based on your infrastructure requirements.
Conclusion: From Sensors to Insight
Structural health monitoring software is no longer a luxury for flagship projects—it's essential infrastructure for any organization managing aging assets under growing loads. The technology has matured beyond proof-of-concept: embedded sensors survive decade-long deployments in brutal environments, mesh networks reliably relay data through kilometers of steel and concrete, AI models predict failures months in advance, and total cost of ownership has dropped to levels justifiable for routine bridges and tunnels, not just marquee structures.
But turning sensor streams into actionable intelligence requires deep integration across hardware, networking, software, and machine learning. Off-the-shelf platforms trade flexibility for convenience, often imposing constraints—locked ecosystems, fixed form factors, proprietary protocols—that mismatch real-world infrastructure. Custom development, exemplified by LunexLab's Bridge project, delivers solutions precisely fitted to deployment requirements: STM32 nodes optimized for sub-millimeter deflection measurement, BLE mesh topology designed for linear structures, store-and-forward resilience for connectivity dead zones, and AI models trained on structure-specific load patterns.
The Bridge system — custom nodes, store-and-forward, a live sag map, and AI on the series — is what we can talk about under NDA: architecture, not invented KPIs. From laser rangefinder selection through neural analysis, every layer was designed in concert for aging infrastructure in hard radio environments.
For infrastructure operators evaluating monitoring systems, the question isn't whether to deploy structural health monitoring software—it's whether to adapt your needs to a vendor's product roadmap or build a solution that adapts to your infrastructure. Explore LunexLab's services to discover how custom development can transform your infrastructure operations.
Ready to discuss your infrastructure monitoring project? Contact LunexLab to evaluate custom SHM solutions, review technical feasibility, and plan a pilot deployment tailored to your specific structures and operational requirements.